Search

So what exactly are you looking for? Let us know and we will help you find the best answer

Explore Mutual Funds

Sytematic filtering of mutual funds across asset classes and criterias to suit your investment needs.

Explore Now
Clear All

Timken India Ltd.

  • NSE: TIMKEN

  • BSE: 522113

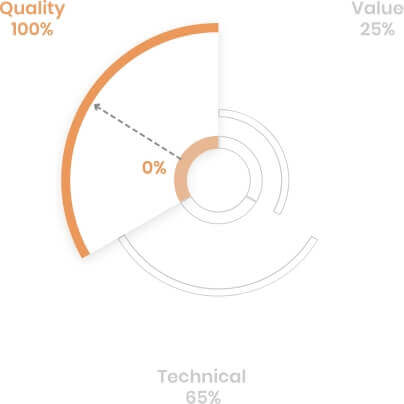
  • Q
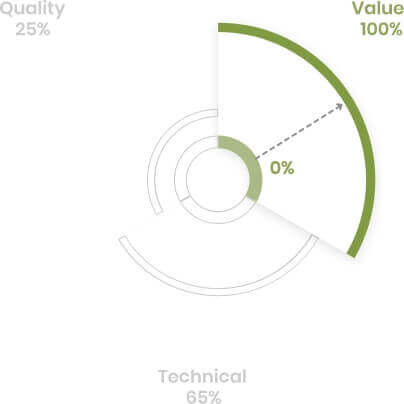
  • V
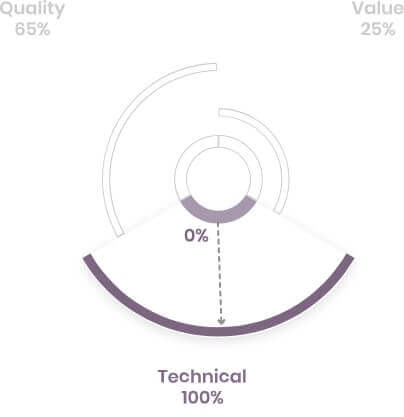
  • T
  • Expensive Performer
64.33/100

Quality Score

High Financial Strength
9.17/100

Valuation Score

Expensive Valuation
57.02/100

Technical Score

Technically Neutral
Broker average target upside %

15.30 %

Below industry Median

TTM PE Ratio

64.60

High in industry

Price to Book Ratio

12.40

High in industry

Operating Revenues Qtr Cr

802.50 Cr

High in industry

Net Profit Qtr Cr

104.50 Cr

High in industry

RSI

68.70

RSI is mid-range

MFI

78.60

MFI Overbought

MACD

74.20

MACD above Signal and Center

MACD Signal Line

64.40

MACD above Signal and Center

30Day SMA Rs

3119.60 Rs

Price above SMA 3119.58

50Day SMA Rs

3015.50 Rs

Price above SMA 3015.52

100Day SMA Rs

3009.10 Rs

Price above SMA 3009.14

200Day SMA Rs

3078.80 Rs

Price above SMA 3078.85

Promoter holding %

67.80

No change in Promoter holding

FII holding current Qtr %

3.95

FII holdings fell by 0.35%

MF holding current Qtr %

11.29

MF holdings rise by 0.14%

Institutions holding %

16.39

Institutions holding decreased by 0.0500%.

Broker Average Rating

5.00

Broker Average Rating

Broker Covering stock

2.00

2 Broker Covering stock

Broker 1Year total

2.00

2 Broker 1Year total

Broker 6M Reco downgrade

0.00

0 Broker 6M Reco downgrade

Broker 6M Reco upgrade

0.00

0 Broker 6M Reco upgrade

Broker 6M Target downgrade

0.00

0 Broker 6M Target downgrade

Broker 6M Target upgrade

0.00

0 Broker 6M Target upgrade

Momentum score

57.02

Technically Neutral

Valuation score

9.17

Expensive Valuation

Quality score

64.33

High Financial Strength

NSE TIMKEN
3355.00
  • 3351.20 Close
  • 3351.20 Open
  • 19.70 K Volume
Today Low/High
Low 3300.00
High 3378.00
52 Week Low/High
Low 2245.05
High 3758.00

Peer Comparison

All values except ratios in INR(Crores)

Stock Name Current Price Rs PE TTM Price To Earnings Market Capitalization In Cr Dividend Yield 1yr % Net Profit Qtr Cr Net Profit Annual Growth YoY % Operating Revenues Qtr Cr Revenue Growth Qtr YoY Price To Book Value
Timken India Ltd. 3356 64.59 25243.39 0.04 104.51 0 802.51 20.24 12.39
Bharat Forge Ltd. 799.5 57.84 37223.8 0.87 250.61 0 3629.05 1.56 5.52
Solar Industries India Ltd. 3831 45.77 34666.75 0 206.1 0 1928.54 46.45 12.6
Grindwell Norton Ltd. 2088 63.88 23118.33 0.57 99.22 0 664.8 18.95 12.72
Carborundum Universal Ltd. 1165 53.45 22128.47 0.3 137.12 0 1199.61 37.99 7.5
Jindal Saw Ltd. 235.15 13.39 7519.01 0.85 353.68 0 5188.04 30.68 1.03
Ramkrishna Forgings Ltd. 373.8 24.08 5976.66 0.58 68.45 0 891.64 24.05 4.52
Kennametal India Ltd. 2430 54.94 5340.7 0.82 15.6 0 255.7 4.07 8.42

Tradebulls Securities is one of the most trusted Indian financial corporations aimed to make trading easier for everyone, even for those who are from a non-trading background. Being in the market for over 11 years, Tradebulls has earned its huge clientele of 2 Lakh+ clients, 2750+ business partners till date. Starting from a small firm with the overwhelming responses and trust from our customers, today we have expanded our operations to 18+ branches in the top cities of India including Mumbai, Bengaluru, Delhi, Ahmedabad, Kolkata, Gandhinagar, Surat, Rajkot, Vadodara. If you are new in the ‘trading business’, you should definitely know about the unique products that we offer to our customers like ‘Target’; to analyse future profit prospects, ‘Portfolio Optimizer’; to select the best portfolio depending upon the required outcome, ‘Investmentz Buckets’; to determine the sensitivity of a portfolio, ‘DIY Screeners’; program to filter stocks as per customer’s requirements. Also, other information related to Equity and Derivatives, Commodity Derivatives, Currency Derivatives, Online Share Trading, IPO, Mutual funds, Demat account, Trading account and Intraday trading are available on our website for you to gain familiarity with. Tradebulls is here for you with its professionally trained team to offer knowledge and guide you through the same.

Keeping some of the common issues faced by traders in mind, Tradebulls introduced a couple of popular online series; ‘Market bloopers’ and ‘Learning series’, which are available on YouTube, Facebook, Instagram, Twitter and LinkedIn. The purpose behind creating these 2 series is to disrupt the myths about ‘trading’ and teach about ‘how to trade’ respectively.

If you are thinking of entering the ‘the world of Share Market or Stock Market’, but do not know where to begin from, reach out to us on the below provided contact details or visit us personally at any of our branches.