Quality Score
Valuation Score
Technical Score
Peer Comparison
All values except ratios in INR(Crores)
Quarterly Results
All values except ratios in INR(Crores)
Annual Results
All values except ratios in INR(Crores)
Financial Ratios
All values except ratios in INR(Crores)
Balance Sheet
All values except ratios in INR(Crores)
Cash Flow
All values except ratios in INR(Crores)
What is QVT?
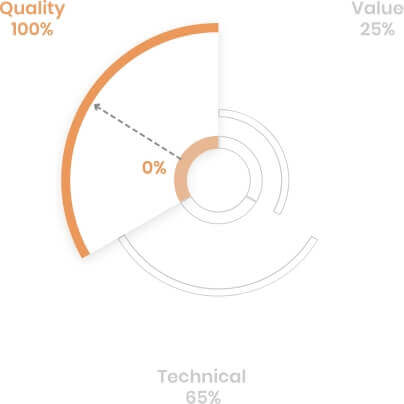
Quality
The Quality Score is based on company's financial and management quality and long term performance. Quality scores above 55 are considered good (G) and below 35 are considered bad (B). Whereas, scores between 35-55 are considered neutral/Medium/Middle (M).
- 10055Good (G) Q
- 35Neutral, Medium, Middle (M) Q
- 0Bad (B) Q
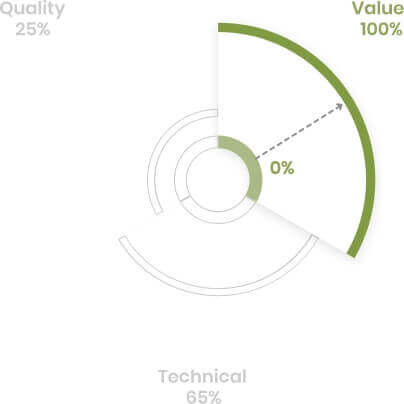
Value
The Valuation Score tracks how expensive the stock is versus its peers. Valuation scores above 50 are considered good (G) and below 30 are considered bad (B). Scores between 30-50 are considered neutral/Medium/Middle (M).
- 10050Good (G) Q
- 30Neutral, Medium, Middle (M) Q
- 0Bad (B) Q
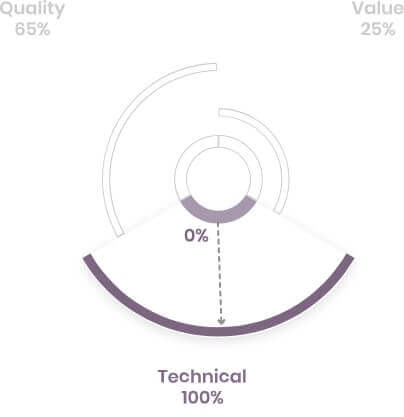
Technical
The Technical Score tracks the bullishness or bearishness of a particular stock relative to the entire stock universe. A Technical Score above 59 is considered good (G) and below 30 is considered bad (B). Scores between 30-59 are considered neutral/Medium/Middle (M).
- 10059Good (G) Q
- 30Neutral, Medium, Middle (M) Q
- 0Bad (B) Q
S
Strengths
W
Weaknesses
O
Opportunities
T
Threats


